
Zachary Nowak
US historian
New Columbian Exchange Maps
The research inspired by Alfred Crosby’s seminal text, The Columbian Exchange (1972) traverses several disciplines, sitting at the intersection of food history, biogeography, and paleopathology. Recently, genetic studies of plant and animal specimens from across the world has contributed to a better understanding both of the domestication of Columbian Exchange (CE) products and of their global diffusion. While there have been occasional critiques of the focus of writing on the CE, largely left unexamined are the radically simplified maps that scholars use to teach about this “exchange.” Using five CE products—sugarcane, maize, quinine, tomatoes, and sweet potatoes—my co-authors and I argue that the current maps impede our teaching, rendering even more difficult our narration of the Exchange because they not only simplify but obscure and marginalize. Better maps are necessary: maps with better projections and more annotations of how products moved individually, in a suite, with exploitative labor practices, in an evolving cultural context, or had dramatic ecological consequences.
Our maps make use (with permission) of the award-winning AuthaGraph projection, created in 1999 by architect and designer Hajime Narukawa and his team. The various versions of this projection substantially reduce size and shape distortions of the Mercator projection while maintaining the familiar rectangular shape of the Mercator maps. Note that, on an AuthaGraph projection, continents can appear in unfamiliar places—the Americas aren’t always on the left, with the Atlantic in the center and the Pacific bisected. This is the genius of the projection—it provides the possibility of centering parts of the globe other than the North Atlantic.
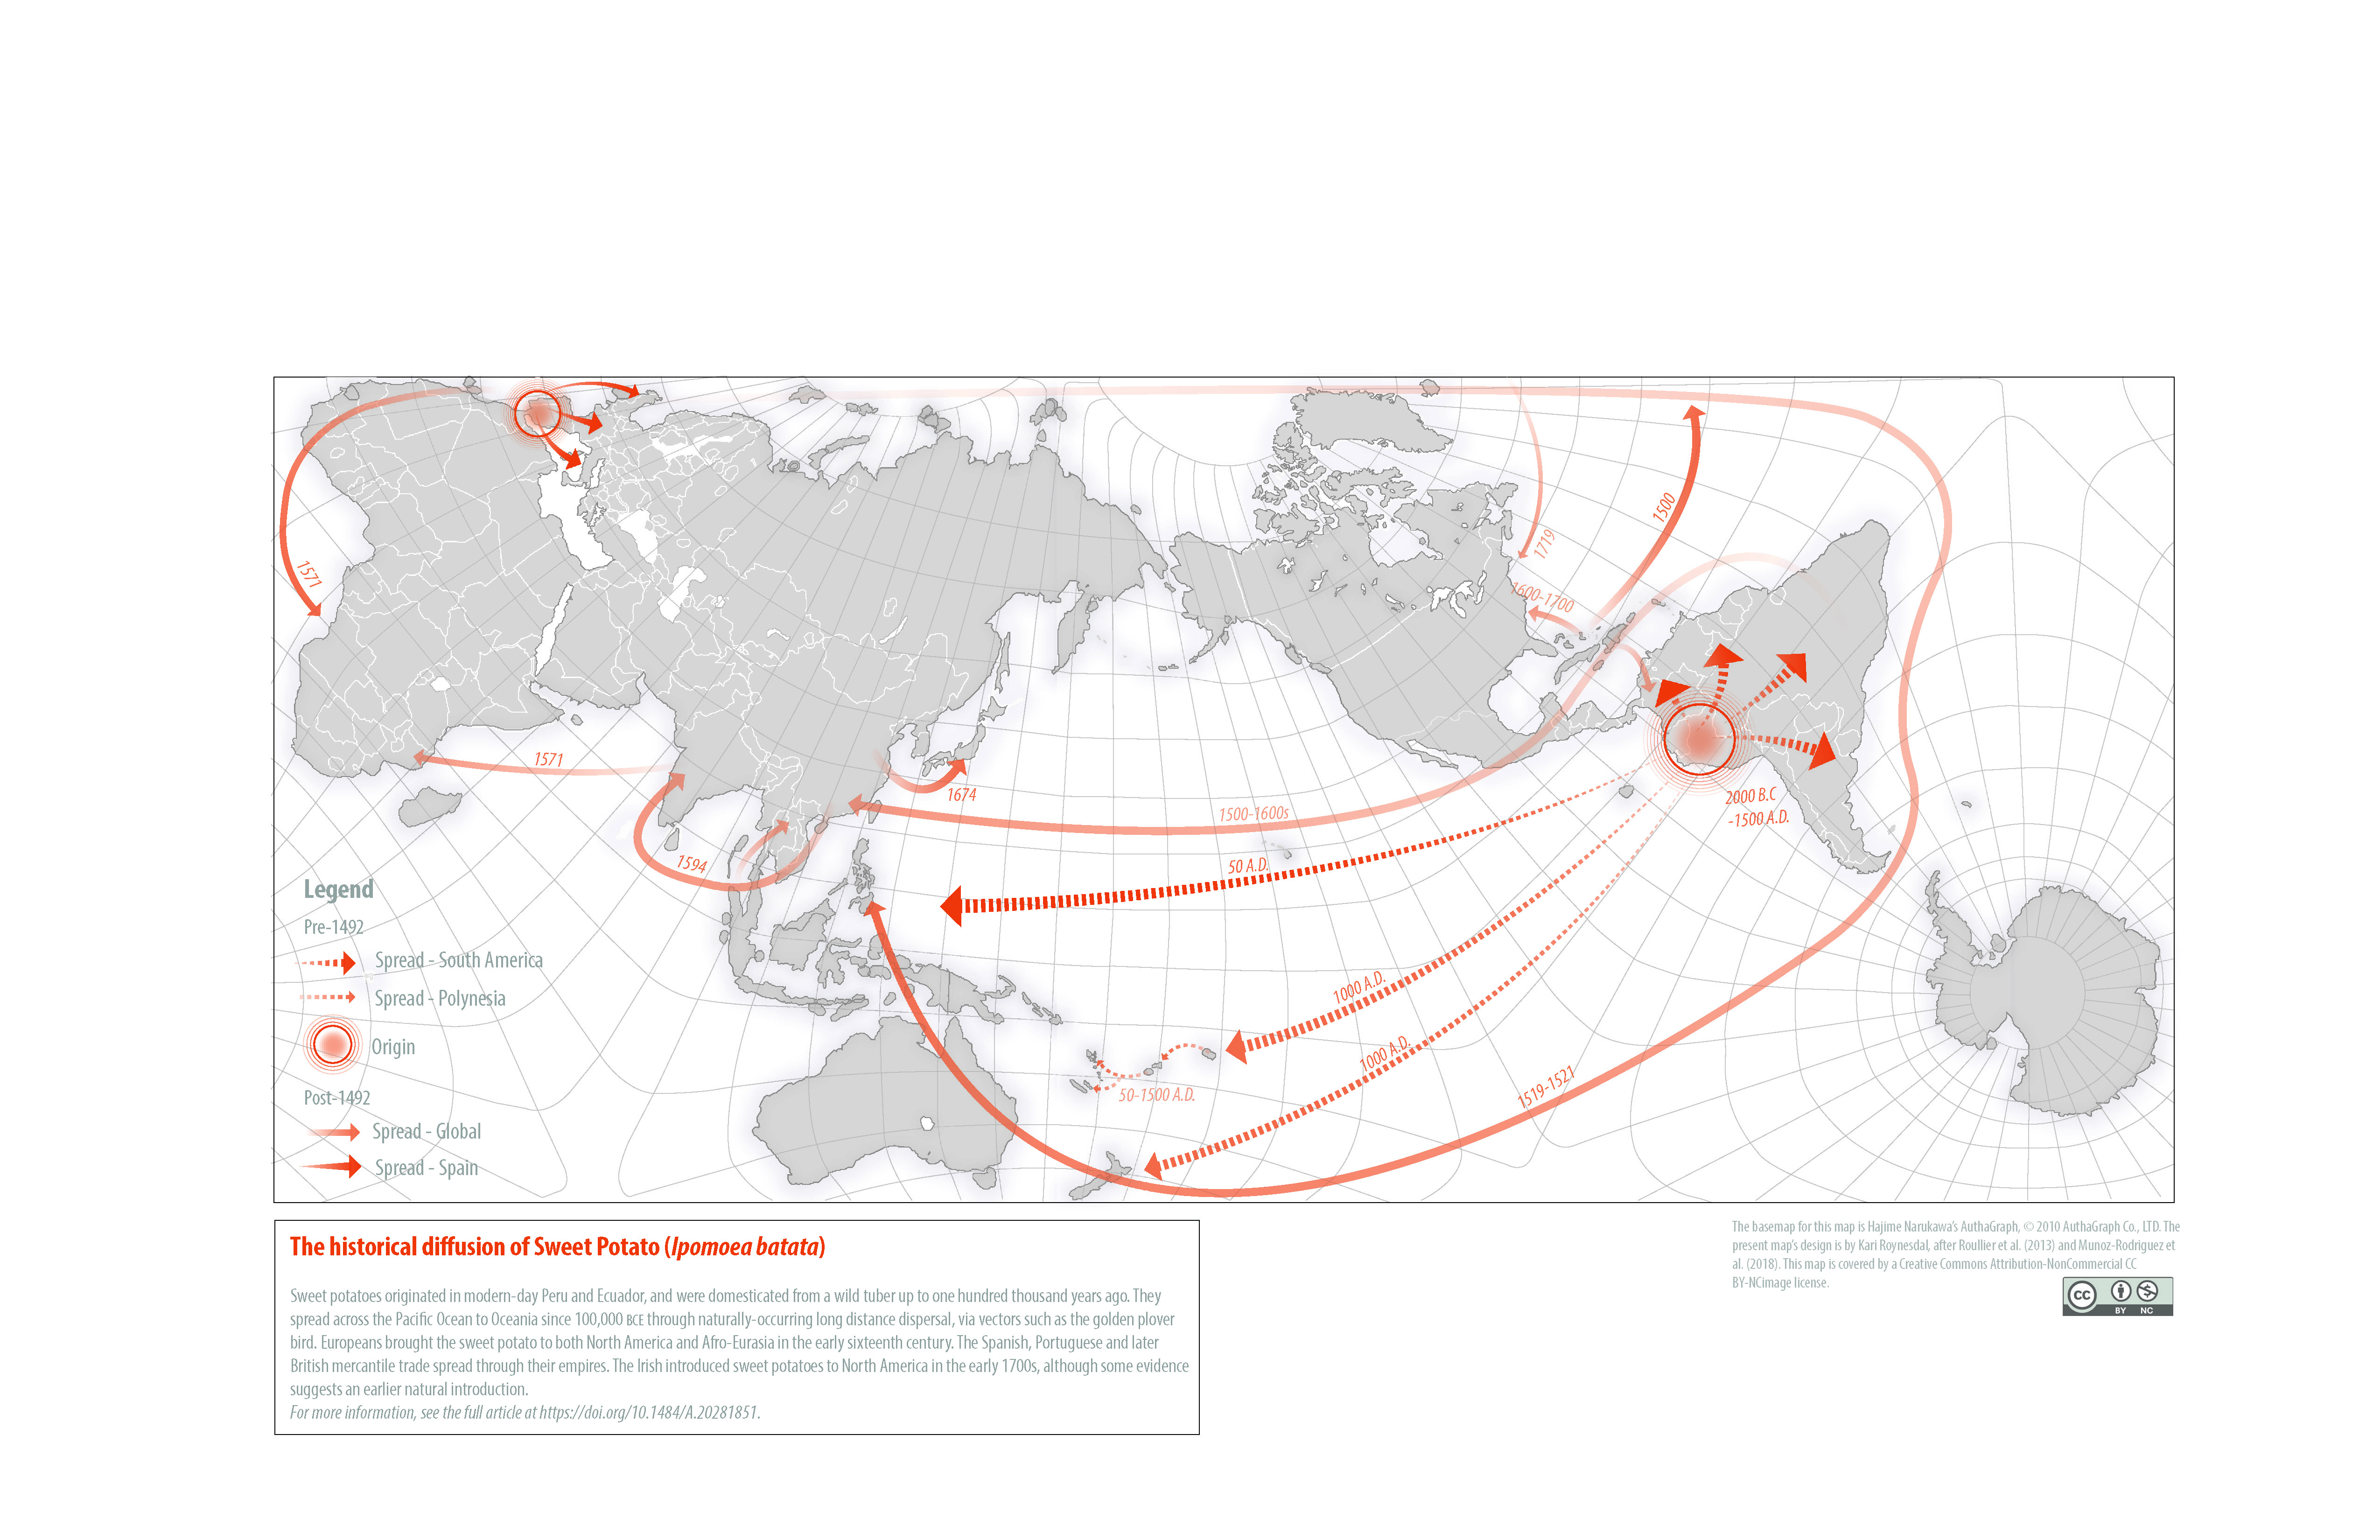
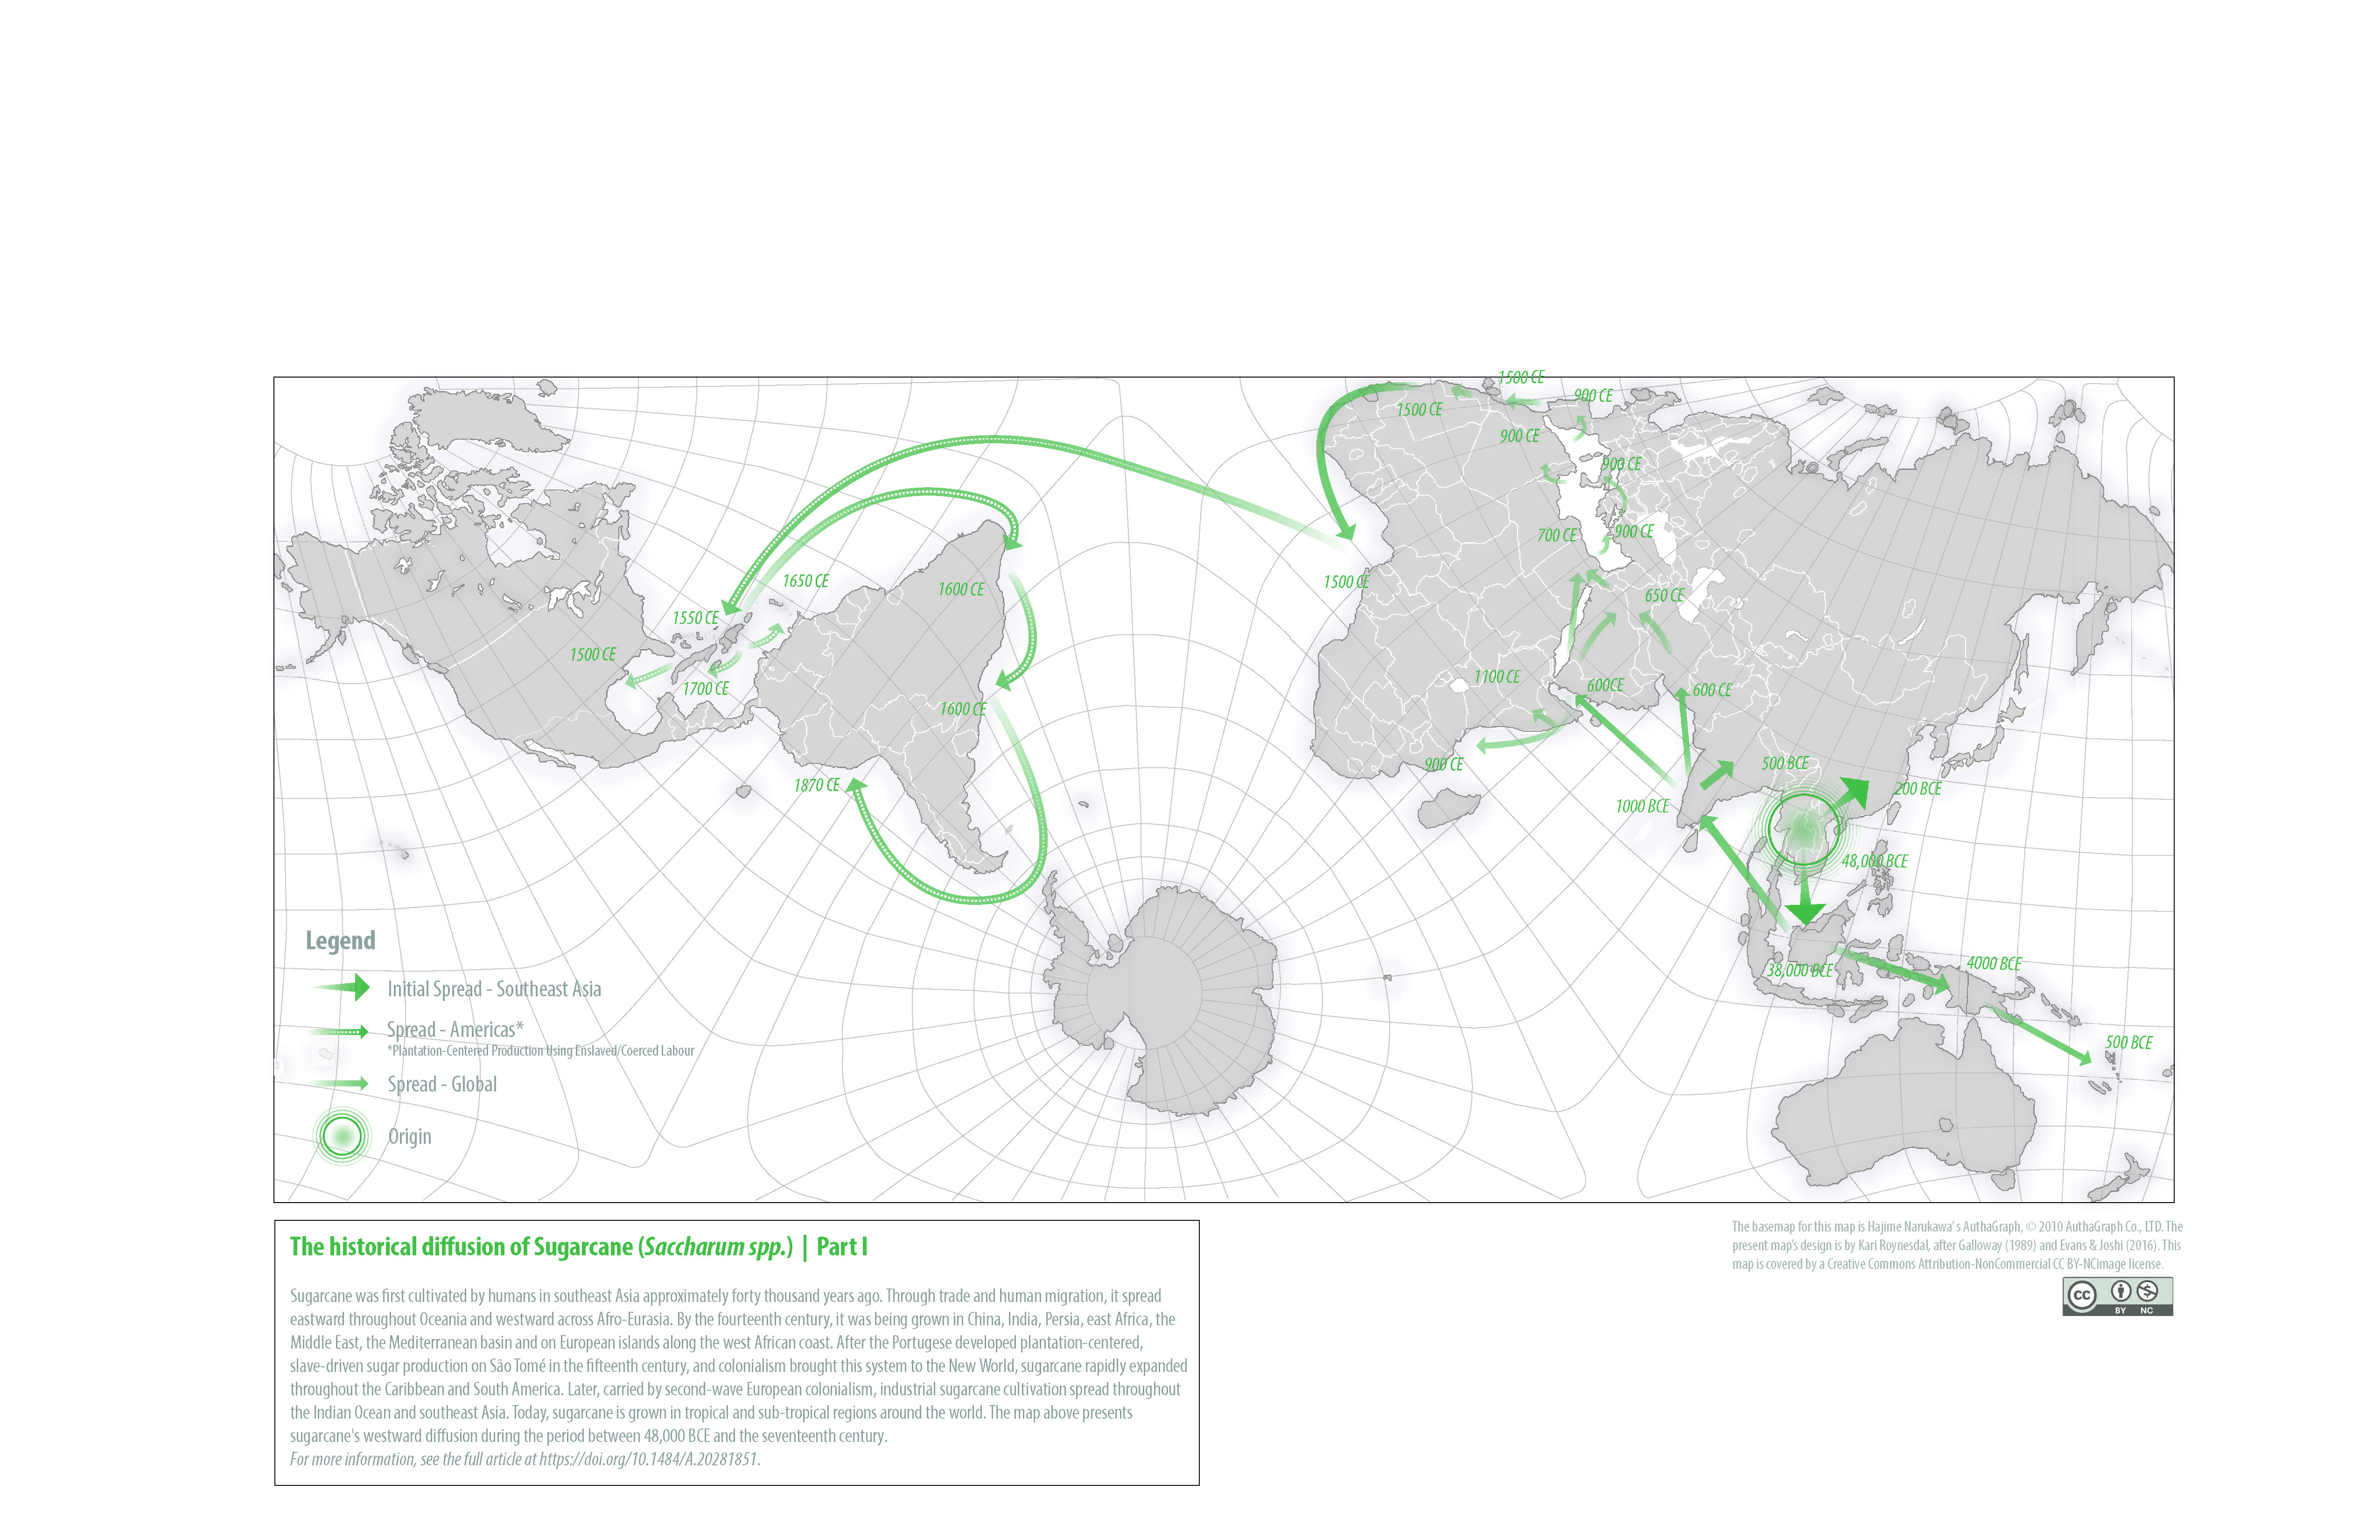
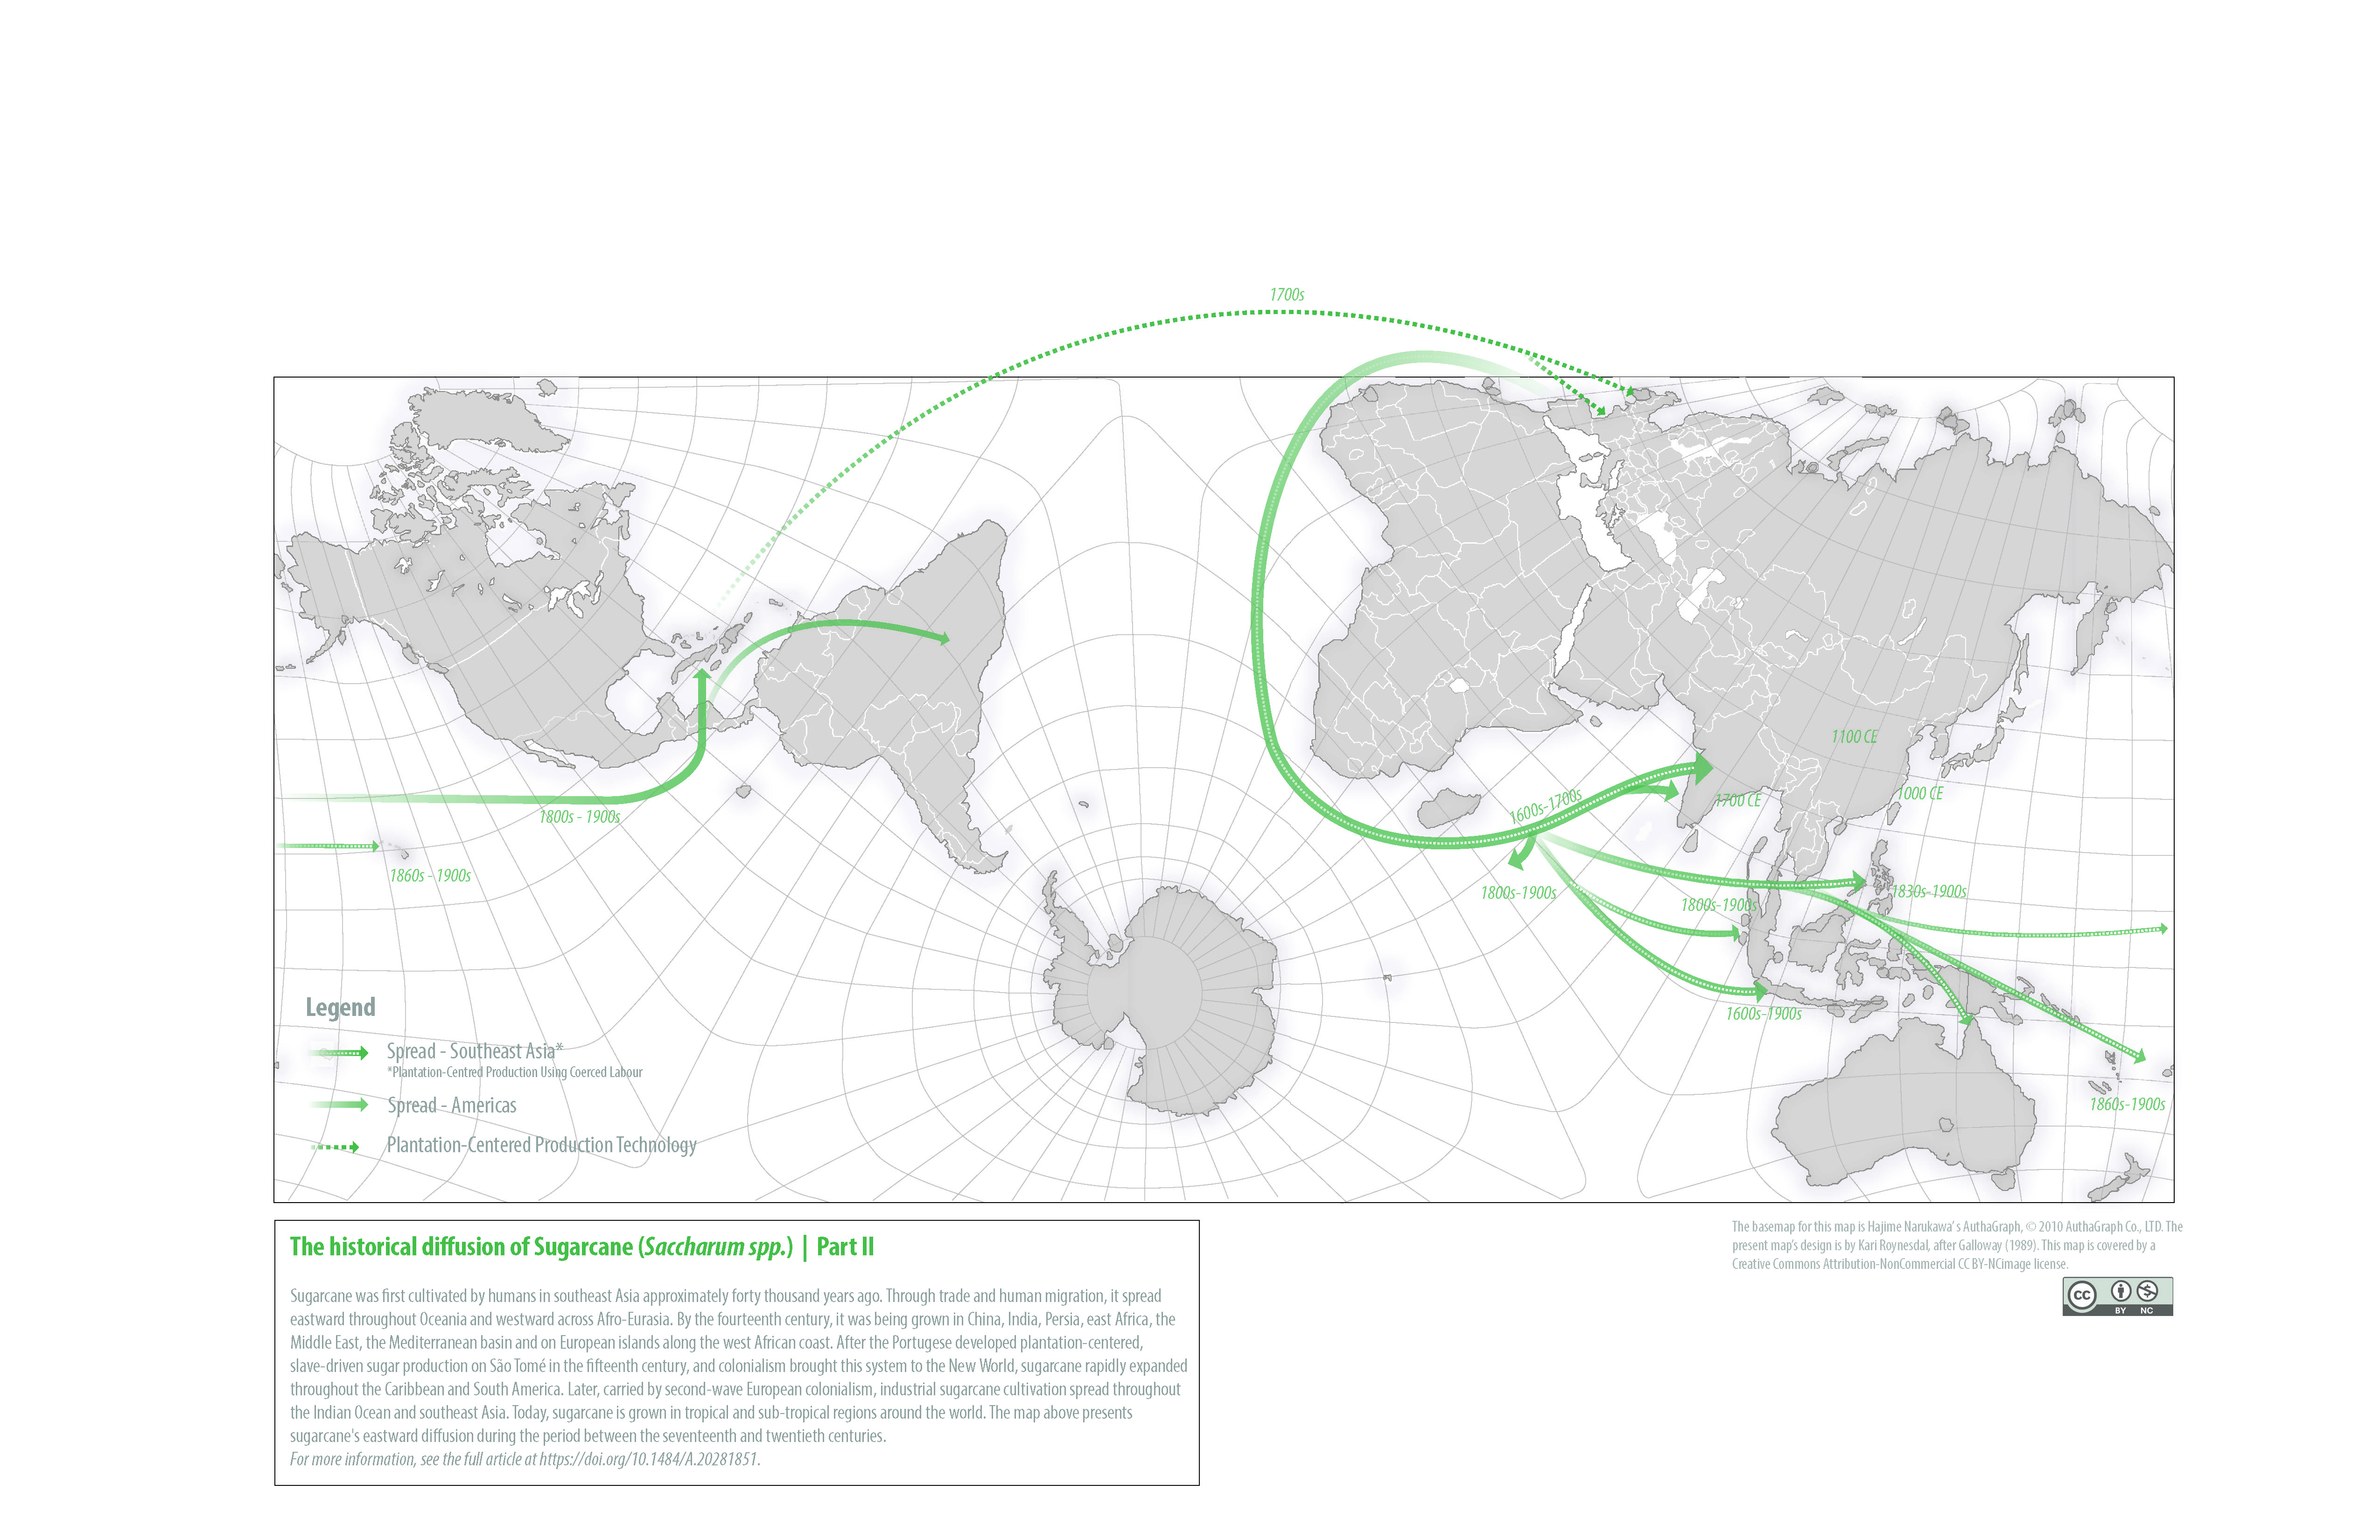
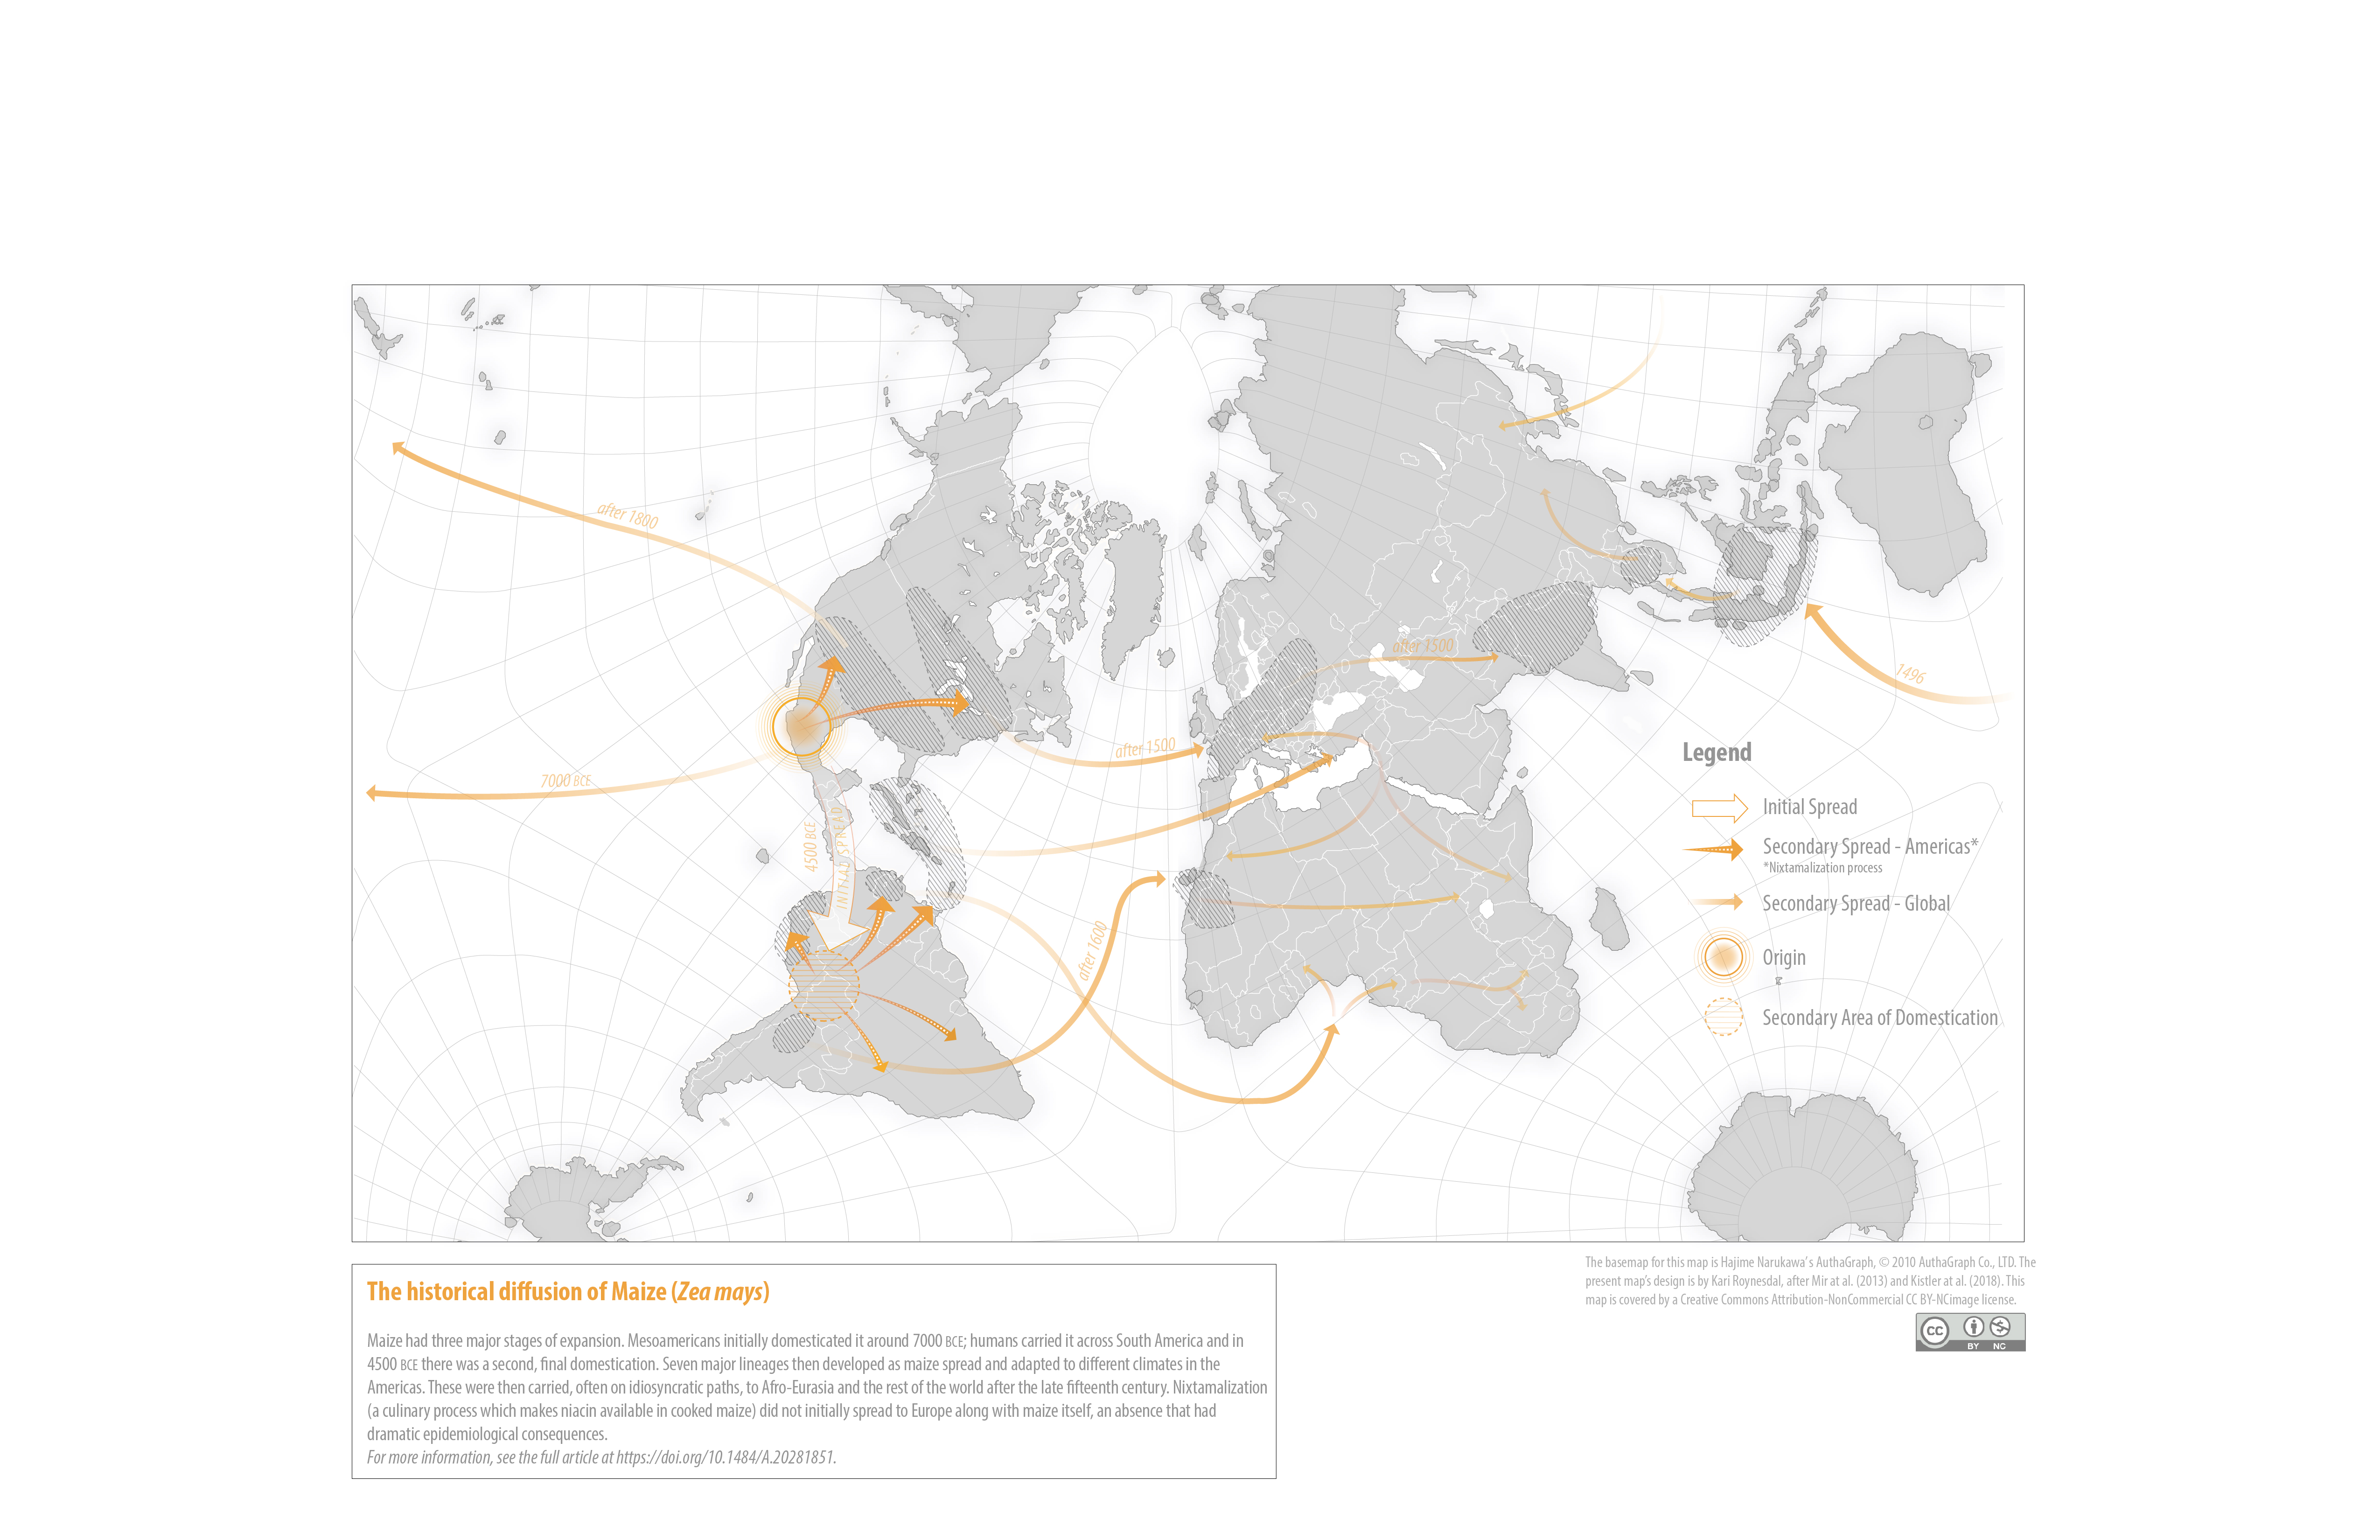
In our article, “(Re)Mapping the Columbian Exchange: Suggestions for an Updated Cartography” (forthcoming in the journal Food & History), we offer short life histories of five products—sweet potatoes, sugarcane, maize, tomatoes, and quinine—paired with a new map for each. Through these products, we seek to highlight the main macro-categories of the cartographic shortcomings of the traditional Columbian Exchange maps: constrained geographic scope, chronological compression, non-depiction of cultural and technological components, non-depiction of concurrent spread with other plants, and the obscuring human consequences. Each product biography and map will, we hope, inspire better graphics from specialized scholars with deeper knowledge of these particular plants’ global trajectories.
While we invite people to read our full article (https://doi.org/10.1484/A.20281851), we offer the maps here and on the publisher’s website. As noted above, we use as a basemap Hajime Narukawa’s AuthaGraph, © 2010 AuthaGraph Co., LTD. The present maps’ design is by Kari Roynesdal. All the maps are free to be downloaded and used in the classroom. All maps are covered by a Creative Commons Attribution-NonCommercial CC BY-NC image license.
Download the new Columbian Exchange maps for free:
A revised map for the diffusion of sweet potatoes.
A first map and second map for the diffusion of sugarcane.
A revised map for the diffusion of maize.
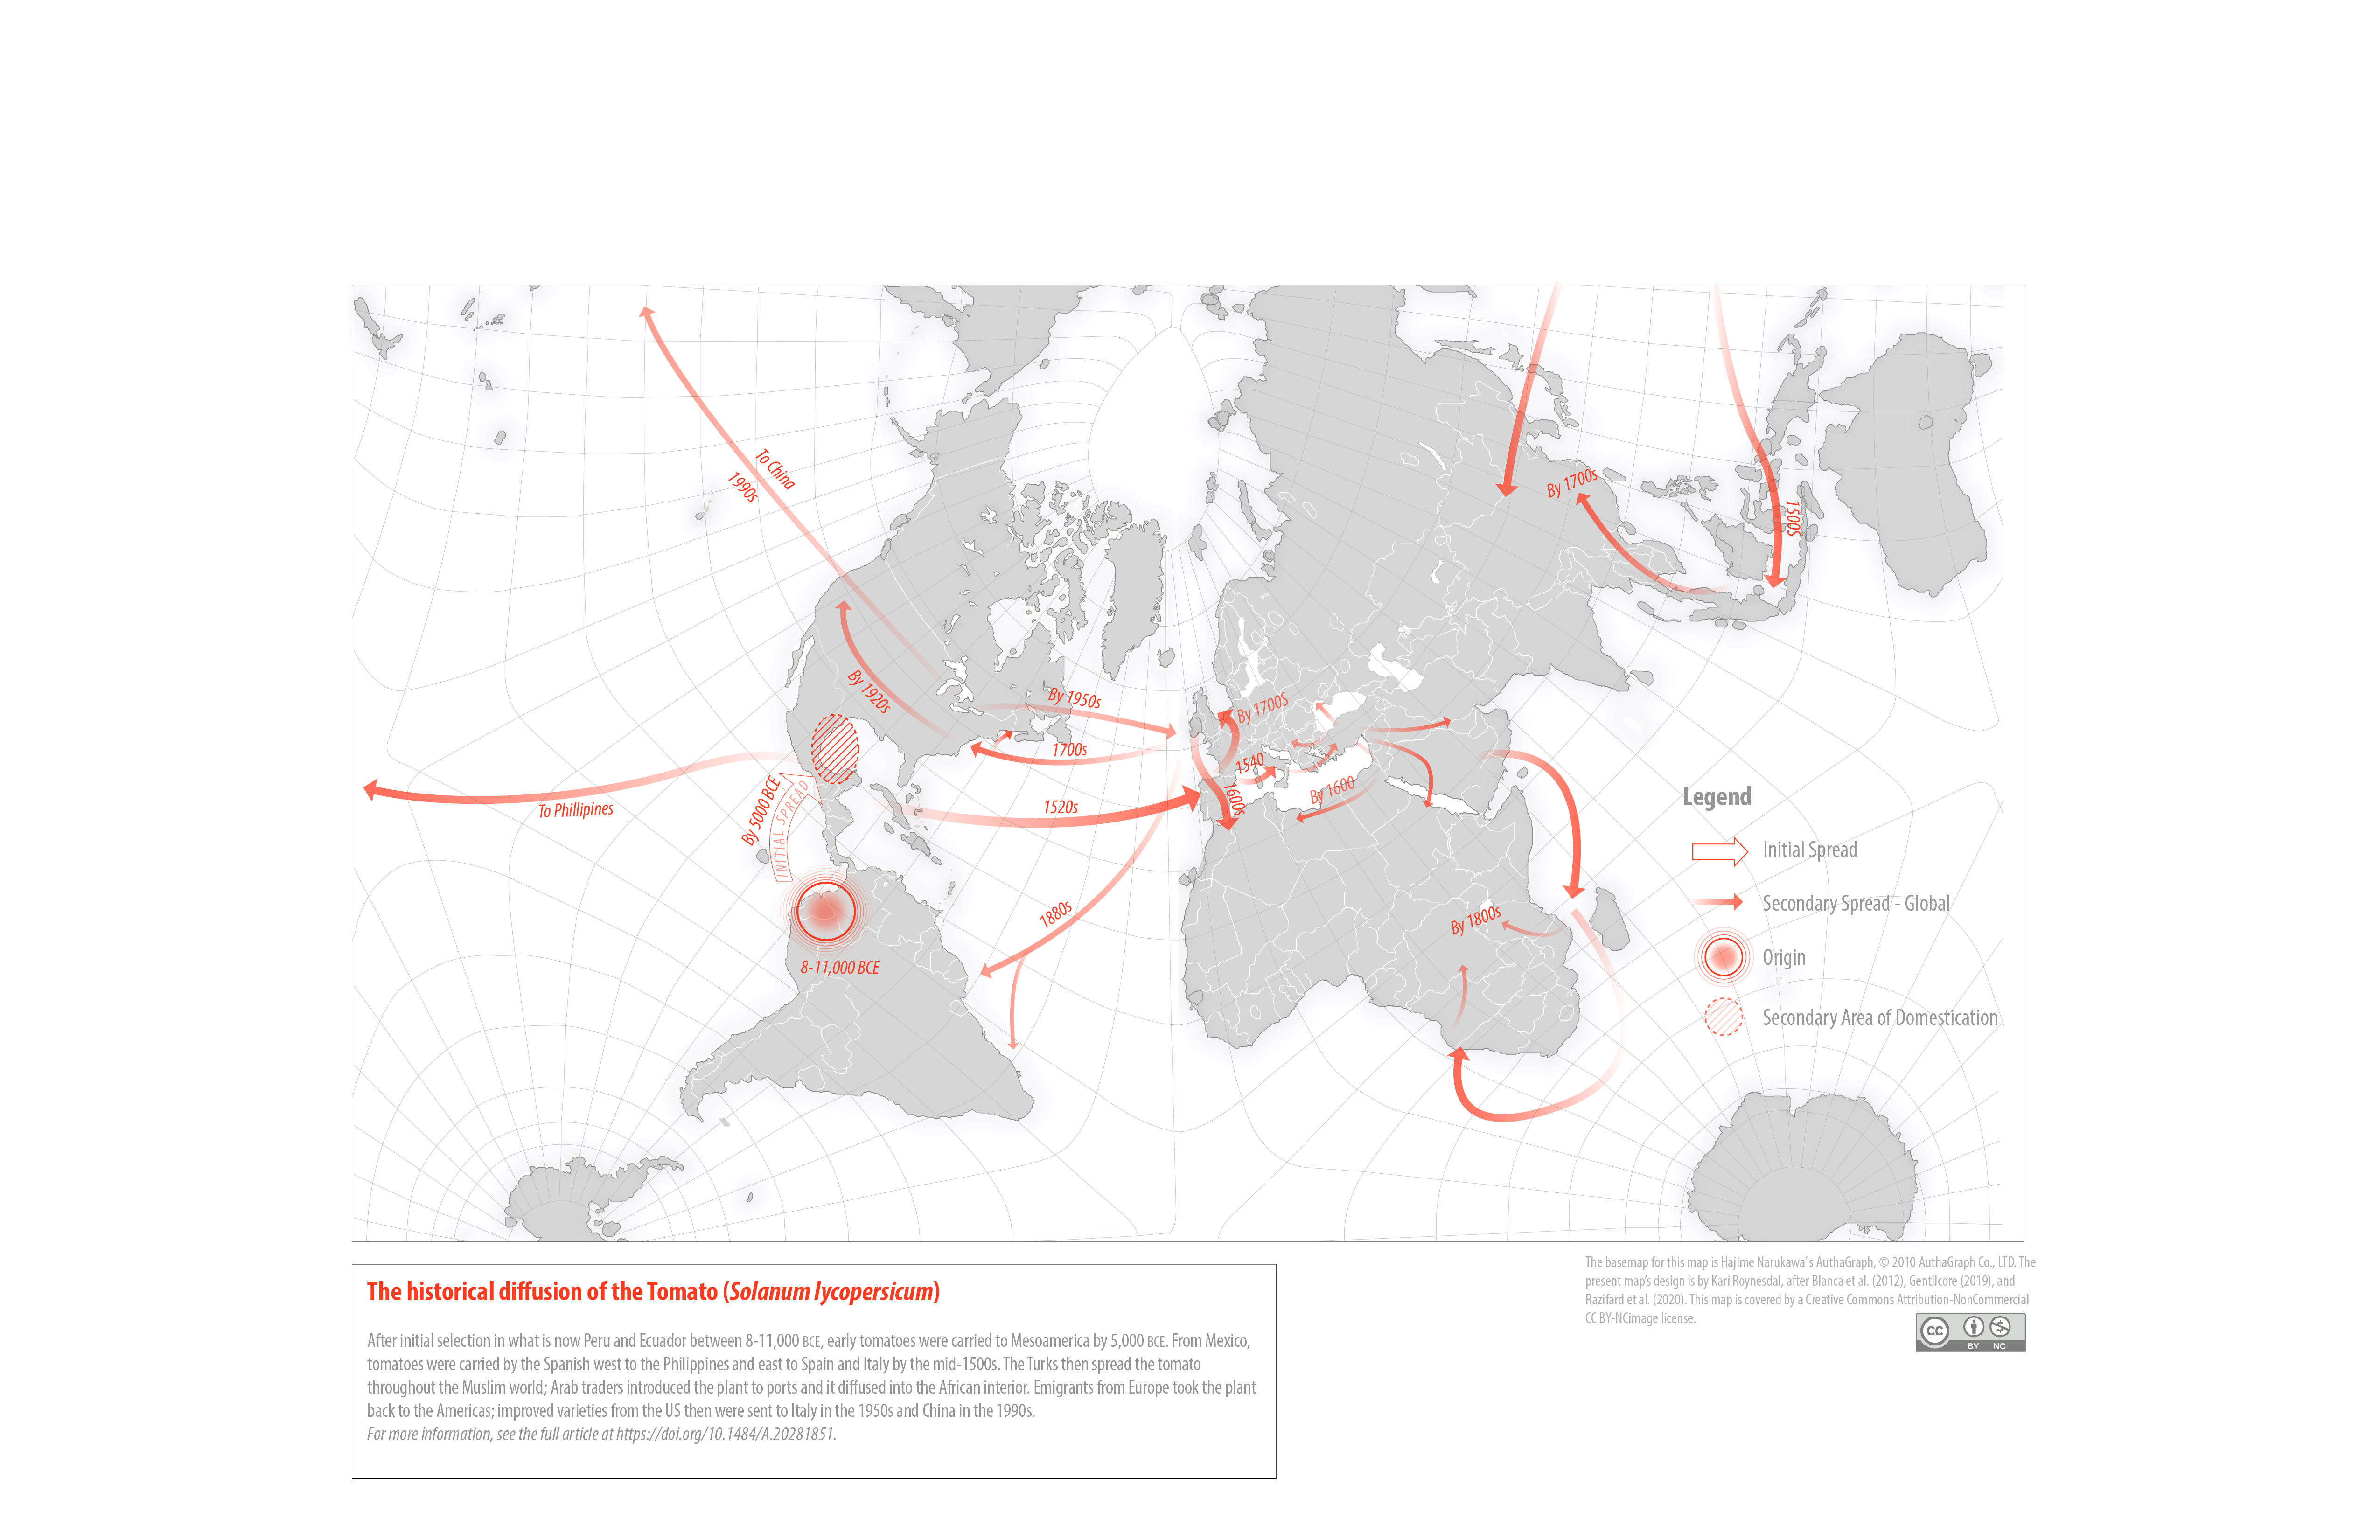
A revised map for the diffusion of tomatoes.
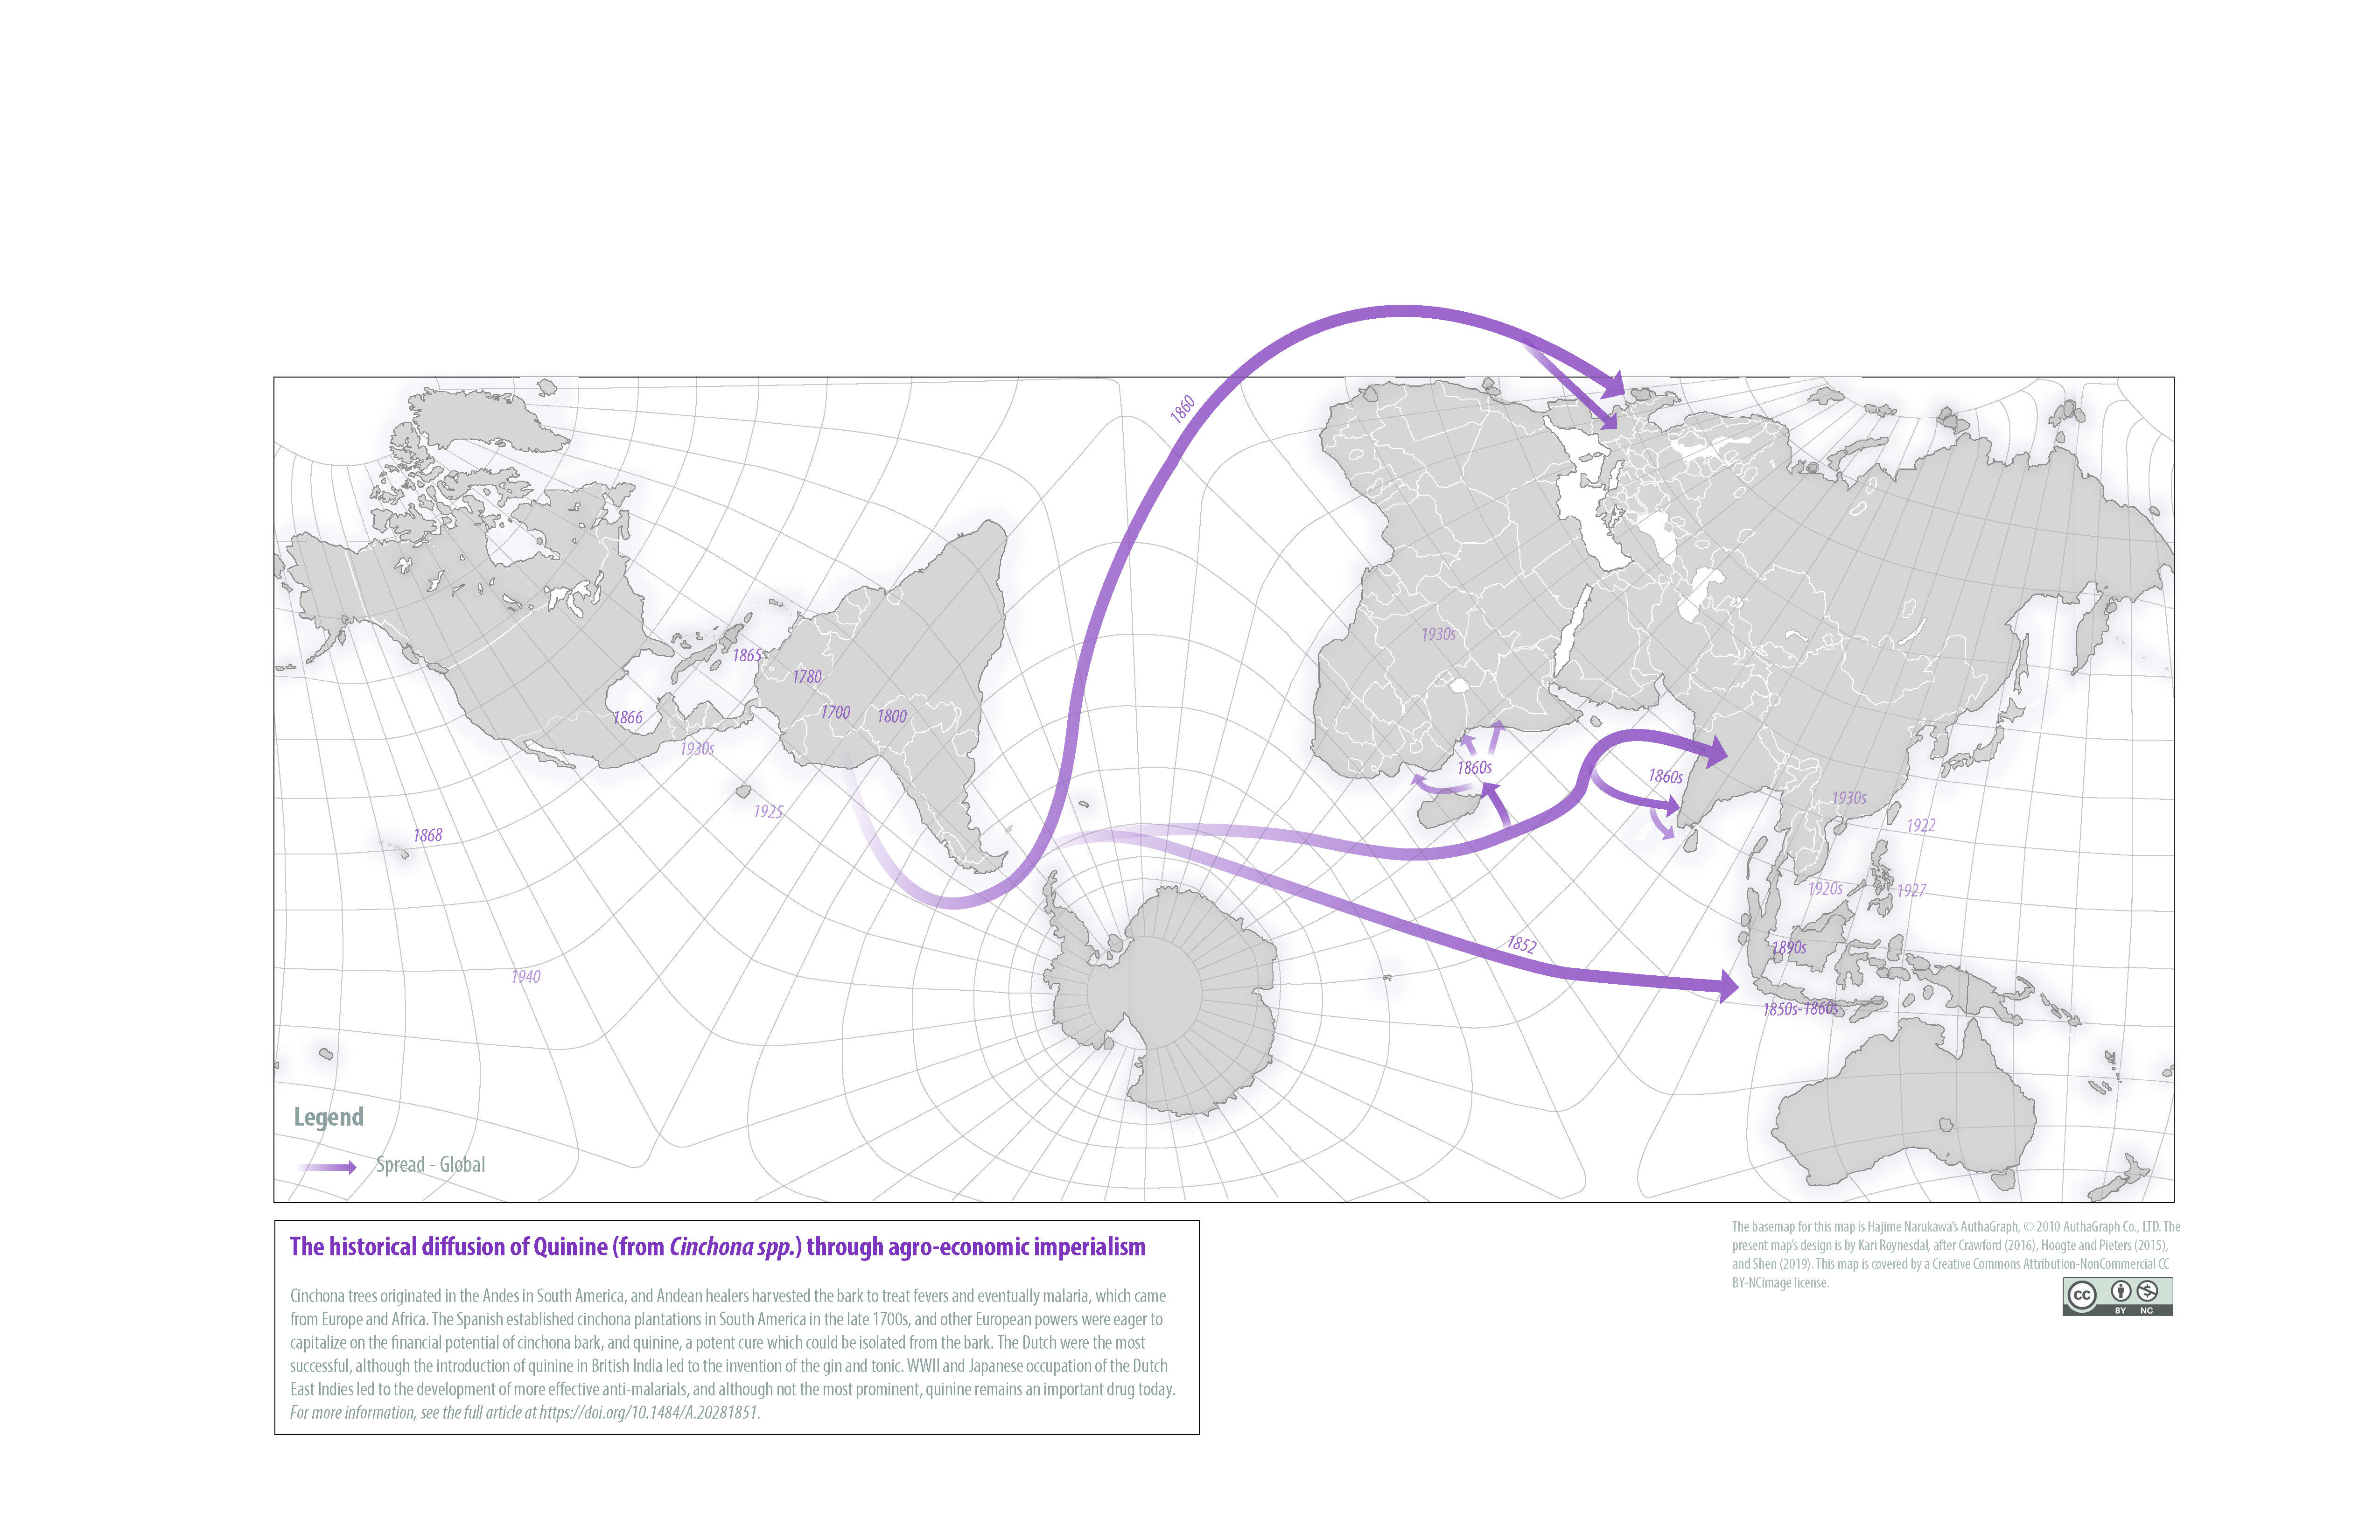
A revised map for the diffusion of quinine.
Download all the new Columbian Exchange maps as a single pdf.